
Stop measuring campaign costs. Start measuring lead value in marketing games.
When a marketing manager presents the results of a gamified campaign to their director, the first question is almost always the same: what did it cost per lead? The conversation rarely moves beyond that number. The cost per lead becomes the verdict. The campaign either passes or fails based on a single metric that says nothing about what those leads are actually worth to the business.
This is one of the most persistent and expensive blind spots in modern marketing. It is not unique to gamified campaigns. But it is particularly damaging in the context of interactive marketing games, because those campaigns consistently produce lead quality that far exceeds what the acquisition cost would suggest. By reducing the evaluation to cost, marketers systematically undervalue one of the most effective lead generation formats available today.
This article explains how lead value works in gamified marketing, how to calculate it correctly, and why shifting from a cost-first to a value-first perspective changes the entire business case for interactive campaigns.
Why cost per lead is the wrong primary metric
Cost per lead is a production metric. It tells you how efficiently your campaign engine converted budget into contact records. It does not tell you whether those contacts will ever buy anything, how much they will spend, or how long they will remain customers. Two campaigns can produce an identical cost per lead while delivering radically different commercial outcomes.
A newsletter sign-up acquired through a discount popup on a checkout page costs very little. A participant who completes a branded game, opts in voluntarily, demonstrates brand affinity through engagement, and provides enriched profile data costs more per record. But they are not the same lead. Treating them as equivalent because the cost columns look similar is a measurement failure, not a marketing insight.
The obsession with cost per lead also creates a structural incentive to optimize for volume over quality. If the only number being tracked is acquisition cost, campaign managers will naturally find ways to reduce friction, lower qualification thresholds, and generate more records at lower cost. The result is larger databases filled with contacts who were never genuinely interested in the brand.
Marketing games break this pattern. The format inherently filters for engagement. A person who chooses to play a branded game, completes it, and opts in for follow-up communication has demonstrated a level of intent that a passive form fill does not. That difference has measurable commercial value. But only if you measure it.
What lead value actually means
Lead value is the estimated revenue or commercial contribution that a single acquired contact is expected to generate, based on known conversion rates and average transaction values within your business.
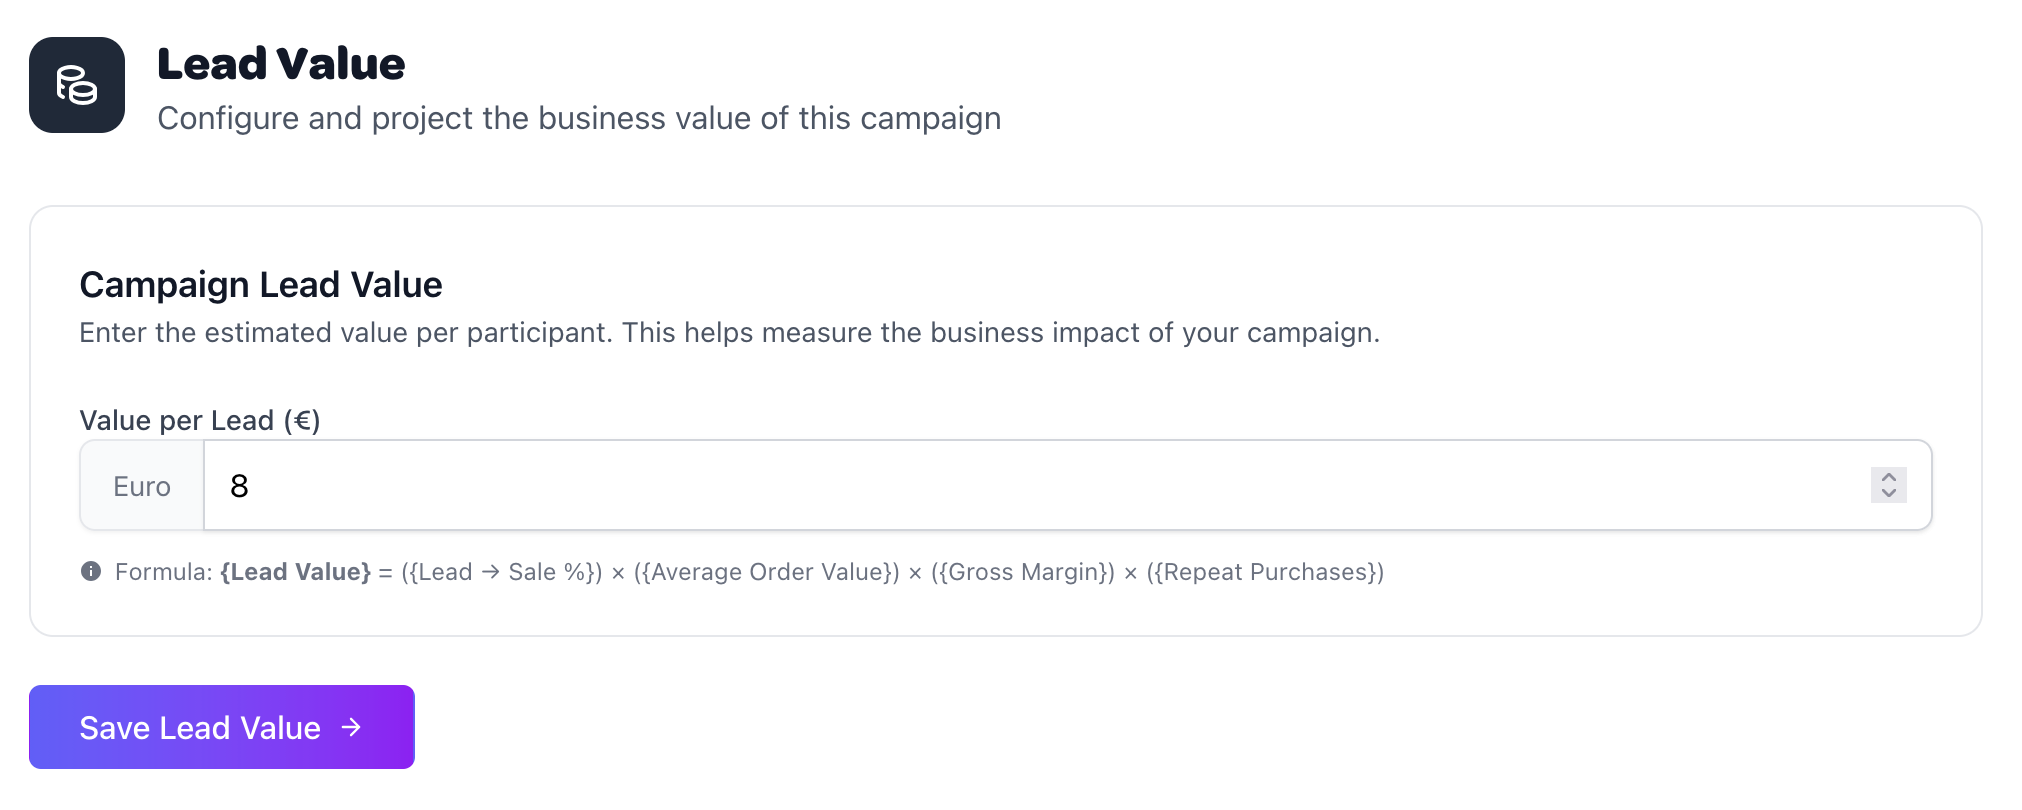
The Refybe platform formalises this in its campaign dashboard with the following formula:
Lead Value = (Lead-to-Sale %) × (Average Order Value) × (Gross Margin) × (Repeat Purchases)
Each variable in this formula is a number you either already know from your CRM or can estimate from historical campaign data. The formula is not theoretical. It is the same logic that underpins customer lifetime value calculations, applied at the point of acquisition rather than retrospectively.
Once you have a lead value figure, the entire financial picture of a campaign changes. You are no longer asking whether the campaign was cheap. You are asking whether it was profitable. Those are fundamentally different questions, and only the second one is strategically useful.
The four inputs that determine lead value
Lead-to-sale conversion rate
This is the percentage of acquired leads who go on to make a purchase within a defined window. For e-commerce brands with newsletter programmes, this is often measurable directly from email platform data. For hospitality, retail, or service businesses, it may require attribution modelling across a longer conversion cycle. Use the most conservative defensible number from your own data. Do not borrow industry benchmarks for this variable.
Average order value
The mean transaction value for first-time buyers acquired through comparable channels. If your business has significant variance between product categories or customer segments, segment this figure accordingly. For campaigns targeting a specific product line or seasonal offer, use the order value relevant to that context rather than a blended company average.
Gross margin
Revenue is not value. A lead who generates 100 euro in revenue at 10% margin is worth less than a lead who generates 60 euro at 60% margin. Including gross margin in the formula converts a topline number into a commercial one. For businesses with consistent margins across product lines, this is straightforward. For those with mixed catalogues, use a weighted average or the margin relevant to the campaign's promoted category.
Repeat purchase multiplier
Many leads acquired through branded game campaigns are first-time customers or reactivating lapsed ones. If your business has reliable data on repeat purchase frequency within a defined period, this multiplier can significantly increase the calculated lead value. Apply it conservatively. A multiplier based on your best customers will overstate the value of the average lead.
Calculation example 1: Newsletter subscriber for an e-commerce brand
A retail brand runs a spin-the-wheel game on their website during a product launch campaign. Participants enter their email address to play and are automatically subscribed to the newsletter on opt-in. The campaign generates 4,200 newsletter subscribers over three weeks.
The marketing team has the following data from previous newsletter cohorts:
- Average first-year order value per subscriber: €30
- Percentage of subscribers who place at least one order in year one: 22%
- Gross margin on first orders from newsletter traffic: 55%
- Average number of orders in year one from converting subscribers: 1.4
The lead value calculation works as follows:
Lead Value = 22% × €30 × 55% × 1.4 = €5.08 per subscriber
At 4,200 subscribers, the projected first-year revenue contribution from this campaign is:
4,200 × €5.08 = €21,336 in margin-adjusted value
If the campaign cost €8,500 to produce and distribute, the return on marketing investment is approximately 2.5x. That calculation is only possible if you know the lead value. Without it, the campaign looks like a cost centre. With it, it is clearly a profitable investment.
It is worth noting that this calculation is conservative. It uses a one-year window, does not account for the brand equity effect of high-engagement interactions, and does not include the value of the zero-party data collected during gameplay, such as product preferences, play behaviour, and declared interests. All of those have incremental value in segmentation and personalisation that is separate from the direct conversion calculation.
Calculation example 2: Hotel booking conversion for a leisure brand
A leisure park operator runs a branded tunnel rush game tied to a seasonal campaign. Participants who complete the game are invited to enter their details for a prize draw and receive a follow-up offer. The game generates 18,000 participants over the campaign period.
Post-campaign attribution data and historical booking patterns provide the following:
- 1 in 100 participants books accommodation within 3 months of playing
- Average booking value: €90 per booking (accommodation only, excluding food and beverage)
- Gross margin on accommodation bookings: 68%
- Average bookings per converting participant within the 3-month window: 1.0
The lead value calculation:
Lead Value = 1% × €90 × 68% × 1.0 = €0.61 per participant
At 18,000 participants, the margin-adjusted value of the campaign is:
18,000 × €0.61 = €10,980
However, this figure is deliberately incomplete, and that is the point. The €90 average booking value explicitly excludes all food, beverage, and in-park spending. For a leisure operator, the accommodation booking is the gateway transaction, not the primary revenue event. A guest who books a two-night stay typically spends significantly more during their visit. If average in-stay ancillary spend per booking is €120, the full lead value recalculates as follows:
Lead Value = 1% × (€90 + €120) × 68% × 1.0 = €1.43 per participant
18,000 × €1.43 = €25,740 in total margin-adjusted value
A campaign that appears marginal at €0.61 per lead becomes clearly profitable at €1.43 per lead once the full commercial picture is applied. This is not creative accounting. It is accurate accounting. The cost-only view was the distortion.
How the lead value calculator works in practice
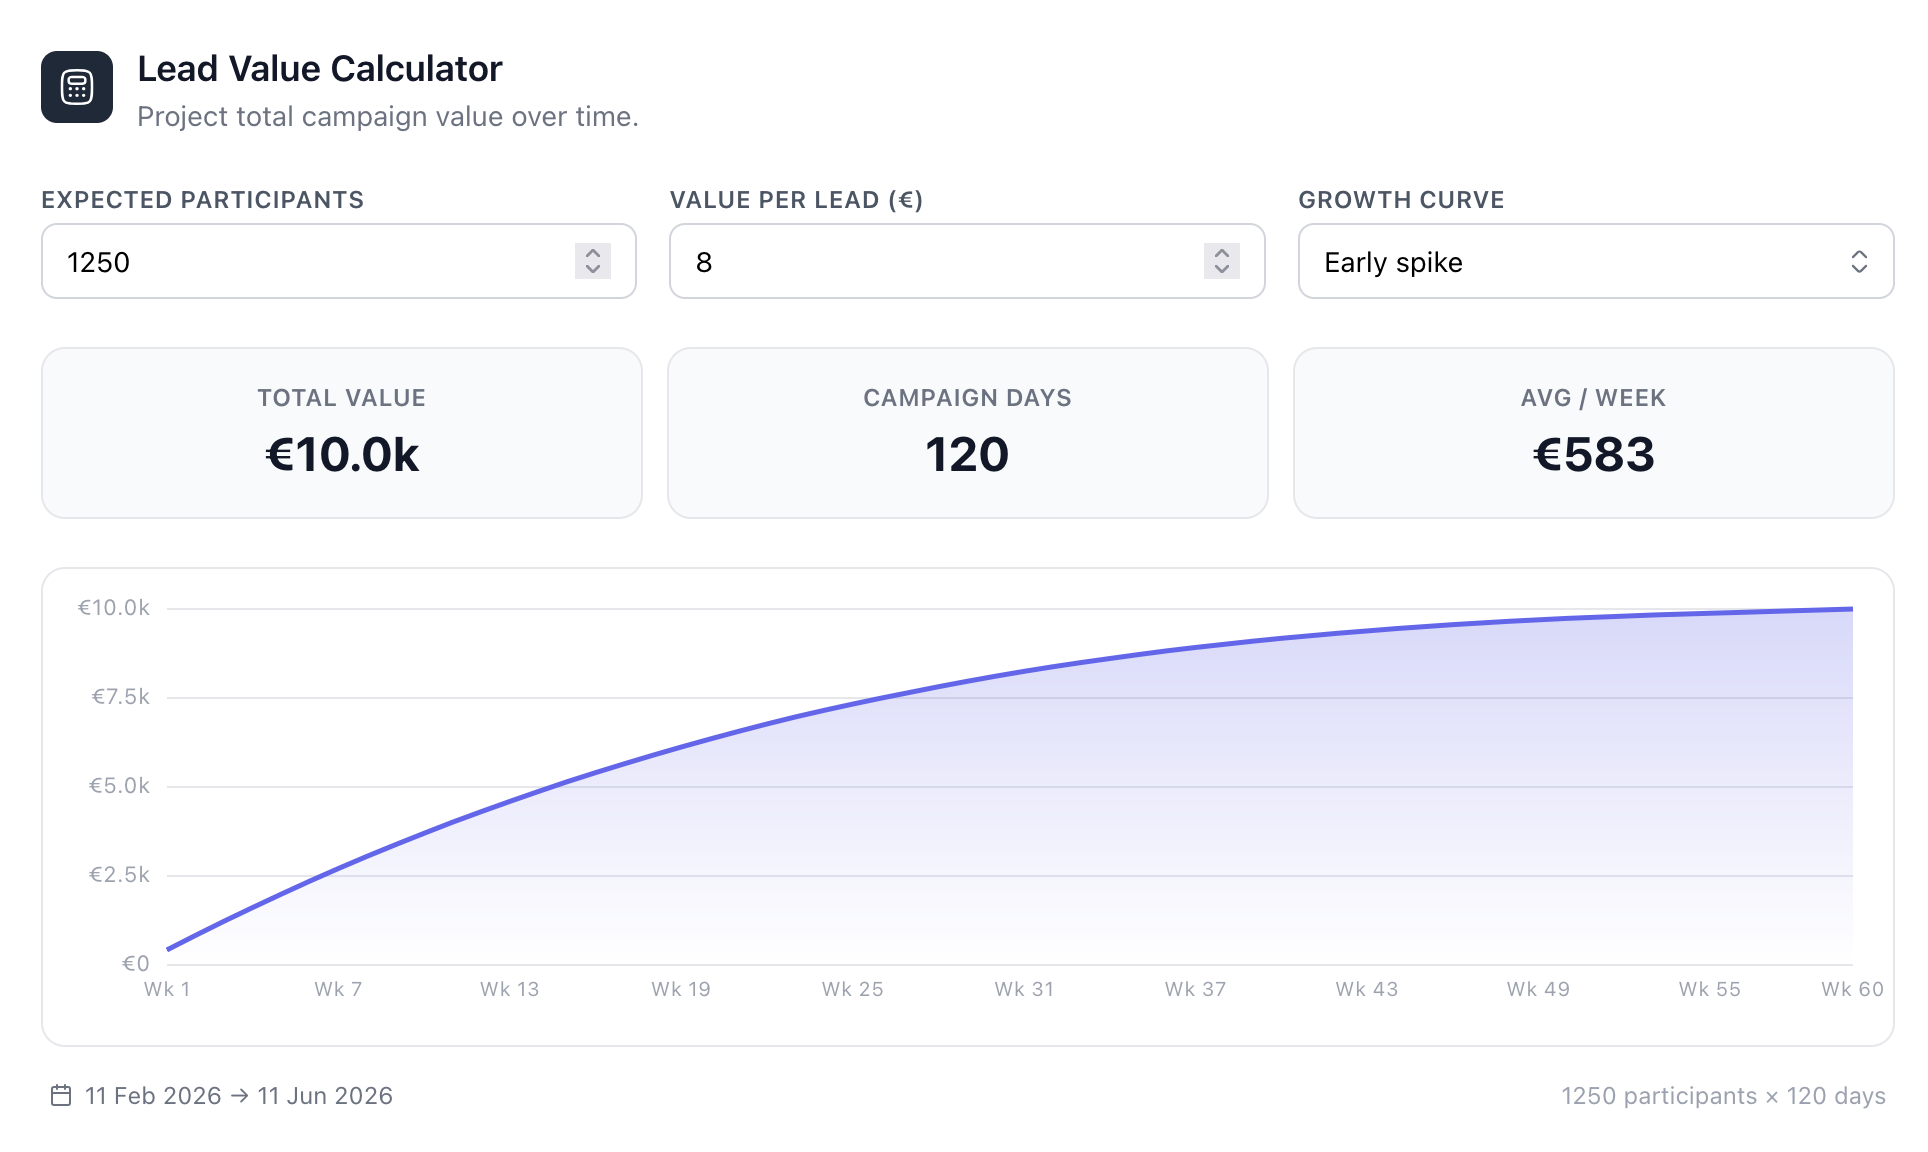
Platforms like Refybe include a lead value calculator directly within the campaign dashboard. The marketer enters a single figure: the estimated value per participant, derived from the formula above. The platform then projects total campaign value across the campaign duration, segmented by day or week, with configurable growth curves reflecting how participant volume typically distributes over time.
The growth curve options reflect real campaign behaviour patterns. An early spike curve models campaigns with heavy launch promotion that taper off. A bell curve models campaigns with a slow start, strong mid-period, and gradual wind-down. A late spike curve models campaigns with delayed paid amplification or PR coverage. Each curve produces a different cumulative value projection against the same total participant count and lead value, which allows the campaign manager to model conservative, expected, and optimistic scenarios before the campaign launches.
The dashboard outputs three primary figures: total projected value, campaign duration in days, and average weekly value generation. These three numbers are what belong in the campaign brief and the post-campaign report. They place the investment in a commercial context that a cost-per-lead figure alone cannot provide.
What lead value changes about how you buy media and justify budgets
When you know the value of a lead, you know how much you can afford to spend acquiring one. This is the fundamental insight that performance marketers have applied to paid search and social advertising for years. The same logic applies to interactive campaign formats, but most marketing departments have not made the connection.
If a newsletter subscriber from a gamified campaign is worth €5.08 in first-year margin contribution, then any acquisition cost below €5.08 is a profitable transaction. You can spend €4 per acquired lead and generate a positive return. You can negotiate media placements, in-store activations, and social promotion budgets from a position of knowing what you can afford, rather than defending a line item against an arbitrary benchmark.
This also changes how you frame campaign proposals internally. A campaign that costs €15,000 and generates 3,000 leads at €5 per lead looks expensive if the benchmark is a display campaign at €1.50 CPL. It looks like an obvious investment if the projected return is €15,240 in margin contribution. The numbers are the same. The frame determines whether the campaign gets approved.
Common objections and how to address them
We cannot attribute bookings or purchases to the game directly
Perfect attribution is rarely available, but it is not required for lead value modelling. You need conversion rate data from comparable acquisition channels, not from the game itself in its first run. Use your email programme data, your CRM cohort analysis, or your direct channel benchmarks as the basis for the lead-to-sale conversion input. As you run more gamified campaigns, you will accumulate your own attribution data and be able to refine the figure over time.
The conversion window is too long to be useful for budget decisions
This is a planning discipline problem, not a data problem. B2C businesses with short conversion cycles of under 30 days can use tight attribution windows. Hospitality and leisure businesses with longer consideration cycles use 90-day or six-month windows. The key is to define the window before the campaign and measure consistently against it. A three-month conversion window for a hotel booking is not a long time horizon. It is a standard post-campaign evaluation period.
Our finance team will not accept projected values as a budget justification
Finance teams accept projected values for every other capital allocation decision in the business. New product launches, store openings, and sales headcount are all justified on projected returns. The reason interactive marketing campaigns are not evaluated the same way is usually because marketers have not presented them the same way. Present the lead value calculation with its inputs sourced from existing CRM and finance data, and the conversation changes.
The data advantage that cost-only thinking ignores
There is a dimension of value in gamified campaigns that does not appear in a conversion calculation at all: zero-party data. When a participant plays a branded game, they generate a profile of engagement data that passive acquisition channels cannot produce. Which game variant did they play? How many attempts did they make? Which prize did they select? Did they share the game? What time of day did they engage?
This data has direct value in personalisation, segmentation, and campaign retargeting. A participant who played a football penalty game and selected a sports-category prize is self-identifying as someone with different interests from a participant who played a recipe challenge and selected a kitchen product. That signal improves the precision and therefore the conversion rate of every follow-up communication sent to that contact.
None of that value appears in the cost-per-lead column. All of it compounds the return on the original acquisition investment. When you are building the lead value case for an interactive campaign, this data asset is the part that is hardest to quantify and easiest to leave out. Do not leave it out. Describe it explicitly, even if you cannot attach a number to it yet. It is part of what you are buying.
Practical steps to implement lead value measurement
- Pull your existing conversion data before the campaign launches. Find the lead-to-sale rate, average order value, and gross margin from your most comparable acquisition channel. Newsletter programme data is usually the best starting point for most B2C businesses.
- Agree a conversion window with your commercial team. Define what counts as an attributable conversion before the campaign runs. Thirty days, ninety days, or twelve months depending on your business cycle. Document this in the campaign brief.
- Enter the lead value figure into your campaign platform before the campaign launches. This forces the calculation to happen before results are available, which prevents the common tendency to retroactively reframe results. It also gives you a projected total value to compare against actual results.
- Report actual versus projected lead value in the post-campaign analysis. If your projected value was €21,000 and the actual tracked value was €17,500, that is an informative delta worth understanding. If it was €26,000, understand why and apply the learning to the next campaign model.
- Build a cross-channel lead value comparison over time. Once you have lead value data from multiple campaign types, email, paid social, game campaigns, events, and referral programmes, you can make evidence-based channel allocation decisions based on commercial return rather than acquisition cost.
Conclusion
Cost per lead is not a useless metric. It measures production efficiency, which matters. But it is not a measure of commercial value, and treating it as one leads to systematic underinvestment in formats that generate disproportionately high-quality leads.
Marketing games are one of those formats. The engagement mechanic filters for genuine interest. The opt-in moment is active, not passive. The data collected during play enriches the contact record in ways that a form fill cannot. And the commercial return, when calculated correctly using conversion rates and average transaction values from your own business, frequently justifies a significantly higher acquisition cost than cost-only analysis would suggest.
The formula is not complicated. Lead-to-sale rate, multiplied by average order value, multiplied by gross margin, multiplied by repeat purchase frequency. Apply it before your next campaign. Present the projected return alongside the projected cost. Then have a different conversation about what the campaign is worth.